Crawl Errors Spiked 50% After Release: What Should I Check First?
Launching a website update or a full redesign is always an exhilarating yet critical milestone in SEO. But what happens when, just after a release, your crawl error rate suddenly jumps by 50% or more? Panic often sets in, and the immediate question is: what went wrong, and how do we fix it?
In this post, we'll walk through the most essential checks to prioritize when you see a spike in crawl errors following a new release. Drawing on real-world insights from leading SEO service providers like Four Dots and tools accessible from platforms such as seo-audits.com, we'll help you bridge the gap between data and action — especially when collaborating with developers during the post-launch phase.
Why Does a Spike in Crawl Error Rate Matter?
The crawl error rate represents how often search engine bots encounter problems accessing your pages. A sudden increase often signals technical issues that can impact indexation, visibility, and ultimately your organic traffic. Monitoring this metric actively through post-launch monitoring is critical.
Common Symptoms with a High Crawl Error Rate
- Pages dropping out of Google Search Console coverage.
- Increased server errors (5xx) or not found errors (404).
- Bot activity that hits redirects loops.
- Increasing errors flagged in log files.
So, where to start? Grab your Slack channel and rally your devs. This is a collaboration sprint, not a one-person show.
Step 1: Confirm the Spike Using Reliable Data Sources
Before diving deep, make sure your crawl error increase is verified from multiple sources. Google Search Console (GSC) is the go-to tool for tracking crawl stats over time.
- Check the Crawl Errors report for patterns in URLs, types of errors, and timeframes.
- Leverage seo-audits.com tools for a comprehensive crawl outside Google’s ecosystem to capture additional issues.
- Use server logs to triangulate bot activity and error codes (more on that shortly).
Pro tip: Don’t rely solely on tool-generated severity scores or PDFs dumped into Slack channels. Instead, prioritize errors by potential impact and frequency to guide your dev handoff efficiently.
Step 2: Analyze Server Logs and Crawl Budget Utilization
Server logs are your secret weapon for diagnosing crawl errors post-launch.
What to Look for in Server Logs:
- Bot Response Codes: Filter for Googlebot and other major bots. Are they hitting more 500 or 404 errors?
- Time Stamps & Patterns: Do error peaks correlate with deployment timing?
- Crawl Rate vs Budget: Has the crawl volume changed while the budget stayed static, or is Googlebot spending crawl budget inefficiently on error pages?
Using log file analytics, analyze if your crawl budget is being wasted on unnecessary redirects, duplicate URLs, or resources blocked by robots.txt or noindex tags introduced JSON-LD during release. Prioritize these areas before chasing less impactful fixes.
Step 3: Investigate JavaScript Rendering and Hydration Issues
Modern sites increasingly rely on JavaScript frameworks and client-side rendering. Unfortunately, this often introduces crawlability issues unseen during traditional HTML crawls.
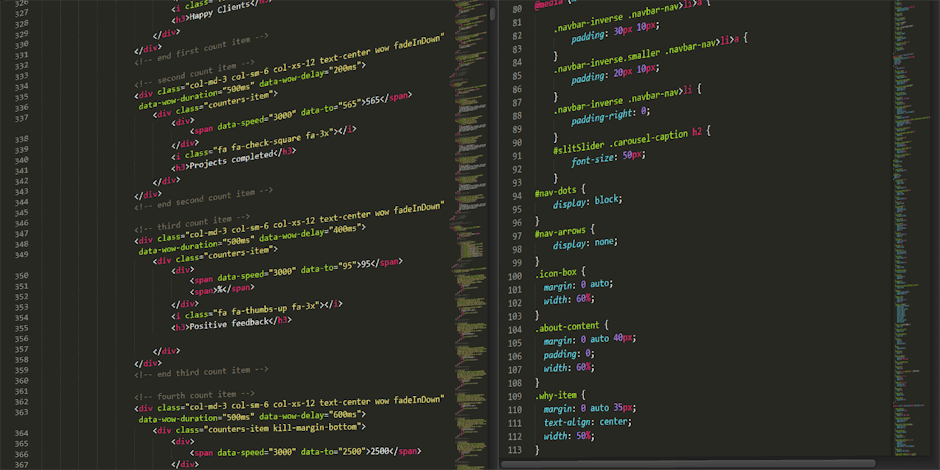
When sites switch to dynamic frameworks or hydrate improperly post-release, Googlebot might see incomplete or broken pages, driving up crawl errors.
How to Diagnose:
- Use the URL Inspection Tool in Google Search Console to view how Googlebot rendered the page.
- Check for JavaScript errors in browser developer tools.
- Run crawls with tools that render JS (like those integrated on seo-audits.com) to surface hydration issues.
Common JavaScript pitfalls include:
- Content loading only after user interaction.
- Missing server-side rendering fallback for bots.
- Incorrectly configured hydration leading to blank outputs.
Working closely with development teams, especially using clear tickets in your project tracker and frequent sync-ups via Slack, helps clarify the fine line between SEO-visible vs developer-visible content.
Step 4: Review Redirects, URL Structures, and Internal Linking
Deployment often introduces structural changes that cause unexpected 3xx or 4xx errors.
Make sure to:
- Audit all new or updated redirects—both temporarily (302) and permanently (301)—to confirm they're resolving correctly.
- Verify your sitemap.xml is updated and reflects the new URL structure.
- Perform an internal linking audit to check for broken links or chains that confuse crawlers.
Handy tip: Map these issues in a table format before handing off to dev, for example:
Issue Example URL Error Type Priority Next Step / Owner Redirect Loop https://example.com/pageA Redirect Loop (3xx) High DEV team to fix redirect chain - ticket #456 Broken Internal Link https://example.com/pageB 404 Not Found Medium Content team to update link - ticket #457Step 5: Address the Implementation Gap and Improve Dev Handoff Processes
One of the most frequent reasons crawl errors spike unexpectedly is due to the implementation gap—what the SEO team recommends versus what actually gets implemented during the release.
This is where SEO strategists from top-tier agencies like Four Dots excel at working cross-functionally to create actionable documentation and staging checklists.
- Document every SEO-critical change in tickets with clear acceptance criteria.
- Require staging environment tests and audits that match production.
- Use Slack channels to ensure immediate feedback loops for any regressions detected.
Remember: Tool outputs (like crawl error reports) are dead data without context and coordination. Always push for tickets that define what needs fixing and when.
Tools vs Services: What Should You Invest In?
This is a classic debate, especially post-launch.
- Tools like Google Search Console, server log analyzers, and crawlers from seo-audits.com empower you to identify issues rapidly.
- Services from agencies like Four Dots can bridge the gap by providing expert implementation assessments, manual audits, and project management for remediation.
The best approach combines both: use tools to capture data daily but bring in services for high-stakes launches, complex JS frameworks, or crawl budget optimization at scale.

Summary Checklist for Tackling Crawl Error Spike Post-Release
- Verify spike through Google Search Console and external crawlers.
- Analyze server logs for error codes and bot crawl patterns.
- Check JavaScript rendering and hydration issues via URL Inspection and rendering-enabled crawlers.
- Audit redirects, URL changes, and internal links for broken paths.
- Ensure implementation matches SEO specs via tickets, staging audits, and dev handoffs.
- Use Slack for instant communication across SEO and dev teams.
- Balance tools and services to sustain continuous crawl health.
Final Thoughts
A sudden 50% rise in crawl errors after release is never trivial, but it’s always fixable. The key lies in structured troubleshooting, tight collaboration, and avoiding hand-wavy “fix duplicate content”-style advice that doesn’t translate into tickets or realistic dev cycles.
By combining the right tools like Google Search Console and server log files, with services from SEO leaders such as Four Dots and seo-audits.com, you can quickly identify root causes and push for fixes that preserve crawl budget and search engine trust.
So next time you see that crawl error spike skyrocket, ask yourself: What ticket will this become?